Climate Summary
30-Year Normal Precipitation
Climate is the long term summary of typical atmospheric conditions. Weather, in contrast to climate, is the daily experience of atmospheric conditions such as temperature, precipitation, humidity, wind, etc. Weather can vary widely from day to day and has a large impact on the agricultural productivity and environmental quality. An early warming period can cause plants to bud, only to be damaged by a spring freeze following the warm period. Periodic rain showers can cause plants to grown ideally. Extended periods of dryness, whether months or years, are droughts.
The AgSite Assessment Tool provides a table of climatic, or 30-year historical weather averages. AgSite reports the historical precipitation averages, called normals, on an annual and monthly basis. These normals are useful for planning. They provide an indication of when rainfall will occur and allow the user to determine if it is appropriate for the growing seasons of different crops or if it can be managed in some way.
Climate is often used to make plans on the assumption that any one year will not deviate far from the average. Of course, weather does deviate from the climatic averages. Events such as El Niño and La Niña give some indication of the direction of change that weather might have from climatic conditions.
Two useful resources to evaluate the deviation of weather conditions from climatic normals is the AgClimate ViewDST and Climate Patterns ViewerDST available on the Useful to Usable Decision Dashboard. The AgClimate ViewDST allows users to locate a nearby weather station and observe the weather for individual years relative to the climatic normals. Climate Patterns ViewerDST allows the user to investigate likely deviations from normals during El Niño and La Niña weather patterns.
AgSite Assessment Tool 30-Year Normal Precipitation is obtained from the Prism Climate Group which estimates average monthly and annual conditions over the most recent three full decades (i.e. 1991-2020). These estimates are not from actual weather stations that record historical precipitation, but from models that estimate the precipitation on a 0.5 mile grid. This 0.5 mile resolution provides estimates of precipitation normals that can change within a single county or even within a few miles. In some areas of the United States, such as near mountain ranges, precipitation normals can be very different within short distances. A more detailed description of the Prism Climate and Weather System is available here.
More detailed climate and weather data can be obtained from the National Oceanic and Atmospheric Administration’s Regional Climate Centers:
- Western Regional Climate Center
- High Plains Regional Climate Center
- Midwestern Regional Climate Center
- Southern Regional Climate Center
- Northeast Regional Climate Center
- Southeast Regional Climate Center
Users with land in Missouri are able to subscribe to a service that provides site specific weather information for their location at Horizon Point. Subscribers receive emails as often as daily on historical and forecasted weather. Horizon Point also incorporates this weather information into models that help farmers manage pests, stored grain, crop fertilization, and other management decisions.
30-Year Normal Temperatures
Climate is the long term summary of typical atmospheric conditions. Weather, in contrast to climate, is the daily experience of atmospheric conditions such as temperature, precipitation, humidity, wind, etc. Weather can vary widely from day to day and has a large impact on the agricultural productivity and environmental quality. An early warming period can cause plants to bud, only to be damaged by a spring freeze following the warm period. Periodic rain showers can cause plants to grown ideally. Extended periods of dryness, whether months or years, are droughts.
The AgSite Assessment Tool provides a table of climatic, or 30-year historical weather averages. AgSite reports the historical high, mean and low temperature averages, called normals, on an annual and monthly basis. These normals are useful for planning. They provide an indication of seasonal temperatures and allow the user to determine if it is appropriate for the growing seasons of different crops or if it can be managed in some way.
Caution needs to be used when looking at high and low monthly temperatures. The high and low temperatures are the average high and low temperatures. They are not the actual high and low temperatures for any one day in a month. For example, a reported low normal temperature in March of 30oF does not mean that the low temperature of any one day is normally 30oF. There will be many days in March where the low temperature dips below this normal, possibly by significant amounts.
Climate is often used to make plans on the assumption that any one year will not deviate far from the average. Of course, weather does deviate from the climatic averages. Events such as El Niño and La Niña give some indication of the direction of change that weather might have from climatic conditions.
Two useful resources to evaluate the deviation of weather conditions from climatic normals is the AgClimate ViewDST and Climate Patterns ViewerDST available on the Useful to Usable Decision Dashboard. The AgClimate ViewDST allows users to locate a nearby weather station and observe the weather for individual years relative to the climatic normals. Climate Patterns ViewerDST allows the user to investigate likely deviations from normals during El Niño and La Niña weather patterns.
AgSite Assessment Tool 30-Year Normal Temperature information is obtained from the Prism Climate Group which estimates average monthly and annual conditions over the most recent three full decades (i.e. 1991-2020). These estimates are not from actual weather stations that record historical temperature but from models that estimate the temperature on a 0.5 mile grid. This 0.5 mile resolution provides estimates of temperature normals that can change within a single county or even within a few miles. A more detailed description of the Prism Climate and Weather System is available here.
More detailed climate and weather data can be obtained from the National Oceanic and Atmospheric Administration’s Regional Climate Centers:
- Western Regional Climate Center
- High Plains Regional Climate Center
- Midwestern Regional Climate Center
- Southern Regional Climate Center
- Northeast Regional Climate Center
- Southeast Regional Climate Center
Users with land in Missouri are able to subscribe to a service that provides site specific weather information for their location at Horizon Point. Subscribers receive emails as often as daily on historical and forecasted weather. Horizon Point also incorporates this weather information into models that help farmers manage pests, stored grain, crop fertilization, and other management decisions.
Predicted Maximum 24-Hour Precipitation
When a structure is built, it is designed to withstand a specific level of weather severity. Drainage features and other conditions are considered when designing structures which so are able to withstand both typical and severe precipitation events. For example, culverts must be sized to accommodate heavy rainfall without flooding roads; and ponds and waste storage structures need overflow features to prevent breaching.
A design storm is the amount of rain a structure was designed to accommodate. Data collected from weather resources determine the design storm thresholds for various timeframes. Government regulations, the importance of the structure, and the discretion of the designing engineer determine which design storm to apply to a specific structure.
Agricultural Site (AgSite) Assessment Tool provides two different design storm estimates in the “Predicted Maximum 24-hour Precipitation” table. The 25-year design storm can be read as, “there is a 4% chance (or once in 25 years) that enough rain will fall within a 24-hour period that the structure would fail to adequately handle the storm.” The 100-year design storm can be read as, “there is a 1% chance (or once in 100 years) that enough rain will fall in a 24-hour period that the structure would fail to adequately handle the storm.”
The AgSite Assessment Tool provides the predicted maximum 24-hour precipitation on approximately a ½ mile grid for most of the United States. Texas and several northwestern states do not have data to provide these rainfall predictions.
For farmers, it is important to design structures to accommodate severe weather and then appropriately manage the structures during intense storm events. If a structure, such as a lagoon, were to overflow, severe environmental impacts, property damage and, possibly, regulatory penalties could result.
Users with land in Missouri are able to subscribe to a free service that provides localized design storm information at Horizon Point. Daily maps of Missouri, divided by county, can be found at Design Storm Maps.
Wind Rose
A wind rose is a diagram that summarizes data about the distribution of wind speed and direction for a particular location and period of time. Wind roses are displayed as a wheel with “spokes” representing 16 directions (N, NNE, NE, ENE, E, and so on). The frequency of wind speed for each direction is represented by “petals” and each petal’s length is determined by the percentage of time the wind is recorded from each direction. The colors, and amount of each color, on each petal vary. The frequency of how strong the wind is in each direction is represented by different colors, classified as wind speed ranges. Percent calms, found above the actual wind rose, reports the percent of time that the wind is recorded as less than 1 mile/hour.
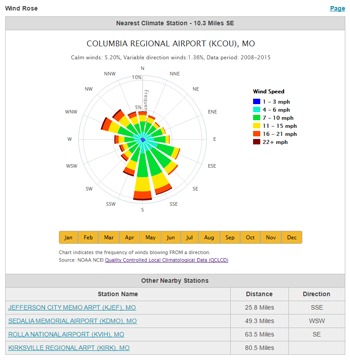 The AgSite Assessment Tool provides an interactive wind rose, customized to the location of the generated report. Initially, an annual wind rose containing data from 2017 through 2021 is displayed. By clicking on the month boxes below the wind rose, single month or multiple month wind roses can be displayed. For example, to see the summer wind rose for a selected location, click Jun, Jul, and Aug under the wind rose in the report. The three months would be colored yellow, indicating that the data from those months is displayed. This feature is especially useful, as wind speeds and direction can vary greatly from season to season.
The lengths and colors of each petal are calculated from hourly records, providing higher accuracy and the ability to customize wind roses. For example, to calculate the wind rose for a location in June, there are 3600 wind speed and direction observations (24 hours per day x 30 days in June x 5 years).
Two peculiarities need to be accounted for when using wind roses. First, AgSite provides a wind rose from the nearest climate station, usually at an airport. The AgSite report displays which climate station the reading comes from, along with how far away it is and from which direction. Sometimes, geographic features make more distant weather stations more appropriate to use. AgSite also lists other nearby climate stations which could assist in making more accurate assessments for the specified location.
Second, it is important to note that airports usually provide wind information at 10 meters above the ground; agricultural weather stations often provide wind information at 3 meters above the ground. In some locations the difference between 3 meter readings and 10 meter readings are important.
More information regarding the history of wind roses, how they are calculated, and how to interpret them can be found at:
- USDA, Natural Resources Conservation Service National Water and Climate Center (NWCC).
- NOAA, Local Climatological Data