Slope and Landscape Features
Soils
For a selected site, AgSite summarizes the site’s soils by “Map Unit Symbol” and “Map Unit Name.” The “Map Unit Symbol” serves as a code to identify a soil type. The “Map Unit Name” describes the soil type. At the minimum, the map unit name column will share the type of soil and a slope range for that soil type. In some cases, the “Map Unit Name” includes a description of erosion and susceptibility to flooding. For more information about a given soil type presented in an AgSite report’s soils table, click on the underlined code in the “Map Unit Symbol” column, and a “Soil Data Map Unit Interpretation Report” will open in a different window. Within the interpretation report, users can learn about the soil’s wind erodibility; drainage class; erosion class; physical and chemical properties; and fit with various agriculture, engineering, forestry and silviculture, grazing, recreation and other activities.
Within the soils table, an AgSite report also lists the number of acres in the selected area that has a certain soil type and the share of a selected site’s total acreage that has a certain soil type. Last, the soils table classifies soil types into one of four hydrologic groups. Soils data presented by AgSite originate from the USDA Natural Resources Conservation Service’s SSURGO database, which was developed using information from the National Cooperative Soil Survey.
The following definitions and explanations provide more information that can help to interpret an AgSite report’s soils table. The explanations also share the significance of soil characteristics.
- Soil type or texture: Soil types named in the “Map Unit Name” column include a description (e.g. silt loam, clay loam, sandy clay) about the extent to which the soil has a sandy, silty or clayey composition. Sand, silt or clay composition refers to the soil’s texture. The following textural triangle illustrates the process used to name a soil’s texture based on its sand, silt and clay content. As the textural triangle indicates, soil that is one-third silt, one-third clay and one-third sand would be considered a clay loam.
Textural Triangle Describing Soil Textures by Sand, Silt and Clay Composition
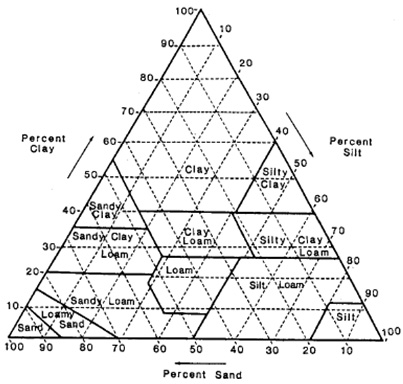
Soil texture is important because it influences water retention, erosion potential, nutrient leaching, drainage capability and agricultural productivity. Sandy soils tend to dry quickly because sand particles create large pores that don’t retain water well. They also may lose nutrients through leaching and risk damage from wind erosion if they’re not covered. Clay soils, on the other hand, don’t drain well, and they may be more difficult to prepare for planting. Soils with a medium texture – not too much sand or too much clay – would create more ideal conditions for growing crops.
- Slope: Slope refers to the extent that a soil surface has an incline relative to the horizontal. In percentage terms, slope represents the elevation that occurs between two different points. As an example, if the elevation between two points that are 100 yards apart is 1 yard, then the area has a 1 percent slope gradient. In its Soil Survey Manual, the USDA Natural Resources Conservation Service classifies slopes into six categories based on slope gradient ranges. Steepness increases as the slope gradient increases.
Slope Classes Named by USDA Natural Resources Conservation Service
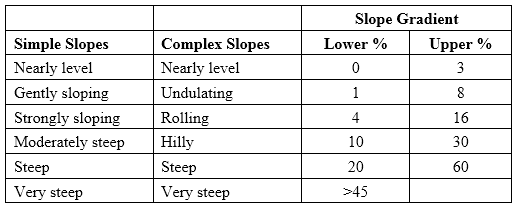
For landowners, slope has significance because it influences erosion potential. University of Wisconsin Extension suggests that soil slopes that exceed 2 percent typically erode if cultivated. When precipitation reaches the soil, its velocity and extent to which the runoff accumulates on the soil surface strengthen when slopes are steep and long. Accumulated water that moves quickly down a sloping surface accelerates erosion. For long slopes, terraces, diversions and strip cropping can address soil conservation concerns. For short and choppy slopes, implementing such practices may be more difficult. In these cases, landowners may consider coupling conservation practices with drainage systems to address runoff and erosion.
- Hydrologic groups:. The USDA Natural Resources Conservation Service developed hydrologic soil groups to describe the extent to which runoff presents a potential challenge. On an A-B-C-D scale, soils in the “A” group have the least runoff potential and the best infiltration. Conversely, soils in the “D” group have the greatest runoff potential and least infiltration. Persons that manage properties with D-rated soils should recognize the risk presented by these soils and consider conservation practices that limit runoff and erosion.
By selecting the “View map” link beside the “Soils” heading in an AgSite report, users can load a map in a separate window that illustrates the distribution of soil types in the surrounding area. The map contains the map unit symbols and boundaries for each soil type. To see more information about a particular soil type shared in the map, click on the area of interest, and the data record for that soil type will load. From the “Map Layers” window, users can choose to add or remove reference map features, such as place names, topographic elements and satellite views. By clicking the “Tools” tab at the top left hand corner of the map, a set of tools appears on the right side of the map. The “Measure Tools” tool allows users to measure a path or an area of interest.
Crop Productivity Index
The National Commodity Crop Productivity Index (NCCPI) was developed to serve as a nationally recognized, consistent tool for land valuation. One of the original reasons it was created was to help value average rental payments for parcels of land for the Conservation Reserve Program. Since its creation, it has also been utilized by the USDA’s Farm Service Agency, Risk Management Agency and Economic Research Service, and real estate assessors for assistance with purchasing decisions.
For a selected area, the AgSite Assessment Tool report displays the “Maximum Productivity Index” for different soil map units, paired with its “Productivity Index Method.” By understanding a piece of land’s soil classification and productivity potential, landowners can make more educated decisions when purchasing and/or managing land. The bottom of the soils table provides a weighted average of the productivity index for the entire selected parcel.
The National Commodity Crop Productivity Index (NCCPI), developed by the USDA National Resource Conservation Service (NRCS), is a systemized rating of United States soil for sections’ capability of growing dryland crops. The soil is rated on a scale of 0 to 1, with 1 being the highest possible rating. The NCCPI uses data from the soil survey database (National Soil Information System, or NASIS) to calculate the rating. Specifically, the NCCPI considers the land’s physical and chemical characteristics, landscape features and climate to calculate its maximum productivity under typical management (see Table 1 for detailed characteristics).
Table 1: Characteristics to Calculate Soil Rating
| Physical | Chemical | Landscape | Climate |
|---|---|---|---|
|
|
|
|
The NCCPI does not consider variable factors, such as management strategies (irrigation, etc.) or land alterations (terraces, etc.).
Another important characteristic of the NCCPI is the classification of its “Productivity Index Method.” The NCCPI is categorized into three (3) commodity classifications/submodels:
- Corn and Soybean Submodel
- Small Grains Submodel
- Cotton Submodel
The “Productivity Index Method” is selected based on which commodity would grow best in the soil, based on the characteristics listed previously.
The User Guide for the National Commodity Crop Productivity Index (PDF) is available from USDA NRCS to help explain further information about the index.
Educational Resources:
To learn more about soils, University of Minnesota Extension developed a five-part educational Soil Management Series that addresses basics about soil science and management practices that landowners can apply to their own land sites. The five modules discuss soil management, compaction, manure management, organic matter management, and soil biology and soil management.
The Soil Quality for Environmental Health effort has had support from multiple collaborators – those include divisions of the USDA Natural Resources Conservation Service, USDA Agricultural Research Service, Iowa State University and the University of Illinois – and it features several resources that may help landowners to learn about soil and maintain it. One tool available on the site is a Soil Problem-solving Guide. For various problems such as compaction, crop disease, salinity and erosion, the online guide lists a few indicators that would suggest that a given problem has occurred, shares several potential causes of the given problem and recommends actions that landowners can take to improve the problem.
Sources and Other Resources:
- Food and Agriculture Organization of the United Nations, FAO Soils Portal
- Missouri Department of Conservation, Order Seedlings
- Missouri Department of Natural Resources, Cost-Share Programs
- Purdue University, Hydrologic Soil Groups
- Soil Quality for Environmental Health, Soil Problem-solving Guide
- Sustainable Agriculture Research & Education, Soil Management
- University of Minnesota Extension, The Soil Management Series
- USDA Natural Resources Conservation Service, Soil Survey Manual
- USDA Natural Resources Conservation Service, Soils
- USDA Natural Resources Conservation Service, SSURGO Database